

We make it simple.
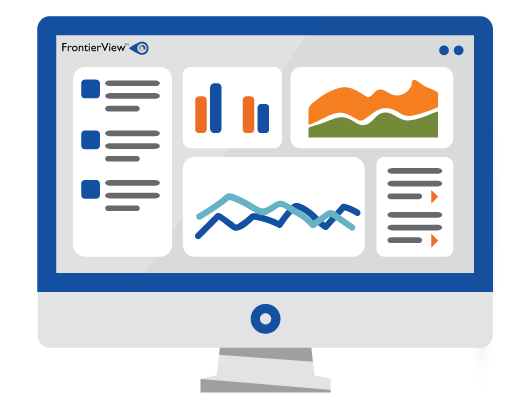
FrontierView™ Dashboards is a fully customizable online tool that integrates all of your FSG research, data, charts, and analyses into a single, highly visual destination. View market data, research, visualizations, industry news, and other resources all one one screen.
Improve your workflow:
- Simplify Data Management: Centralize our data with your other third party data sources for one view of your data universe
- Track your Key Markets: Monitor leading indicators of your key markets with powerful heat maps, charts and visualizations
- Anticipate Volatility: Receive monthly forecast revisions and alerts that ensure you stay ahead of market events
- Align your Team: Leverage a common source of market insight across regions, countries or internal corporate silos
Find out what FrontierView Dashboards can do for you. Fill out the form, and we’ll set up a time to show you a live demo.
Fill out the form, and we’ll set up a time to show you a live demo.